PCHMR: Empowering and Benchmarking Human Mesh Recovery in Privacy-Constrained Real-World Settings
A benchmark of transformer-based human mesh recovery when raw images remain on each client, together with locally generated labels for personalization.
1 University of Cambridge 2 University of Oxford 3 The University of Hong Kong 4 HKUST 5 Texas A&M University
* Equal contribution. † Corresponding authors.
Transactions on Machine Learning Research (TMLR), 2026
Abstract Motivation Overview Method Benchmark Results Local Personalization
Abstract
Fine-tuning on user-side data can improve widely used human mesh recovery (HMR) models, but existing training methods commonly assume that sensitive human images can be collected on a central server. PCHMR studies what changes when those images remain on each client. We benchmark two transformer-based, non-parametric HMR models under federated training and a secure-aggregation variant, covering different numbers of clients and both balanced and uneven data partitions under explicit assumptions about server behavior. We also introduce DePoser, a local annotation and fine-tuning method that combines keypoints predicted by Sapiens with relative depth. DePoser allows a shared model to be adapted to a user's local images without sending them to the server. The in-the-wild personalization results measure agreement with DePoser-generated labels rather than accuracy against independent 3D ground truth. The study records the behavior, cost, and limits of HMR training without centralized access to raw images.
Motivation
Body modeling is moving into personal and home devices.
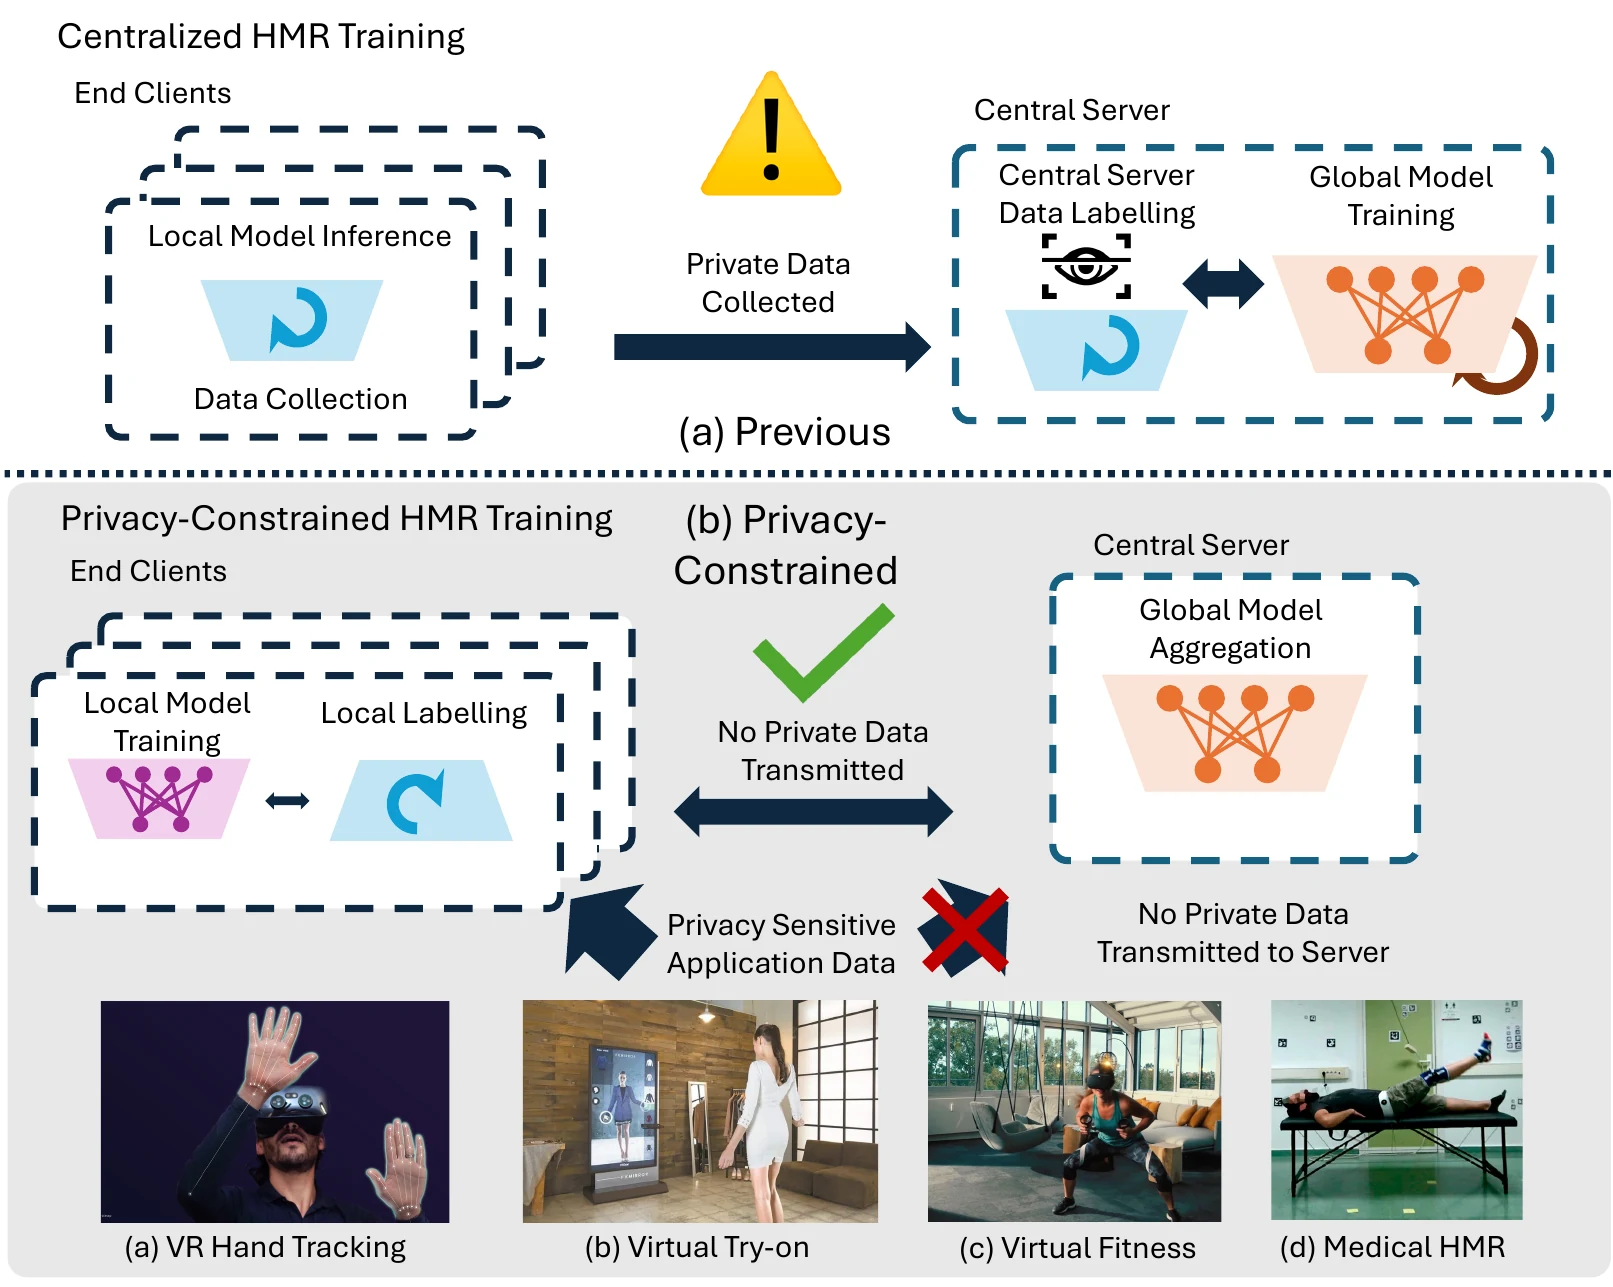
Human pose and body shape are already supported by major personal-device platforms and applications. Meta Quest tracks body motion to animate VR avatars and provides pose-comparison tools for fitness exercises; Apple's Vision framework estimates 3D body joints for exercise tracking, sports analysis, and character animation; Google ML Kit supports mobile fitness-pose recognition and repetition counting; and Snapchat's Clothing Try-On uses a body mesh that follows a person's movement and shape. These systems can observe identifiable images, body geometry, and motion inside homes and other private spaces. Personalizing an HMR model may improve its fit to a particular user, camera, and environment, but collecting those images on a central server creates avoidable exposure. PCHMR studies how HMR models can be trained and adapted while the images remain on the user's device.
Overview
Centralized HMR versus training without uploading raw images.
Method
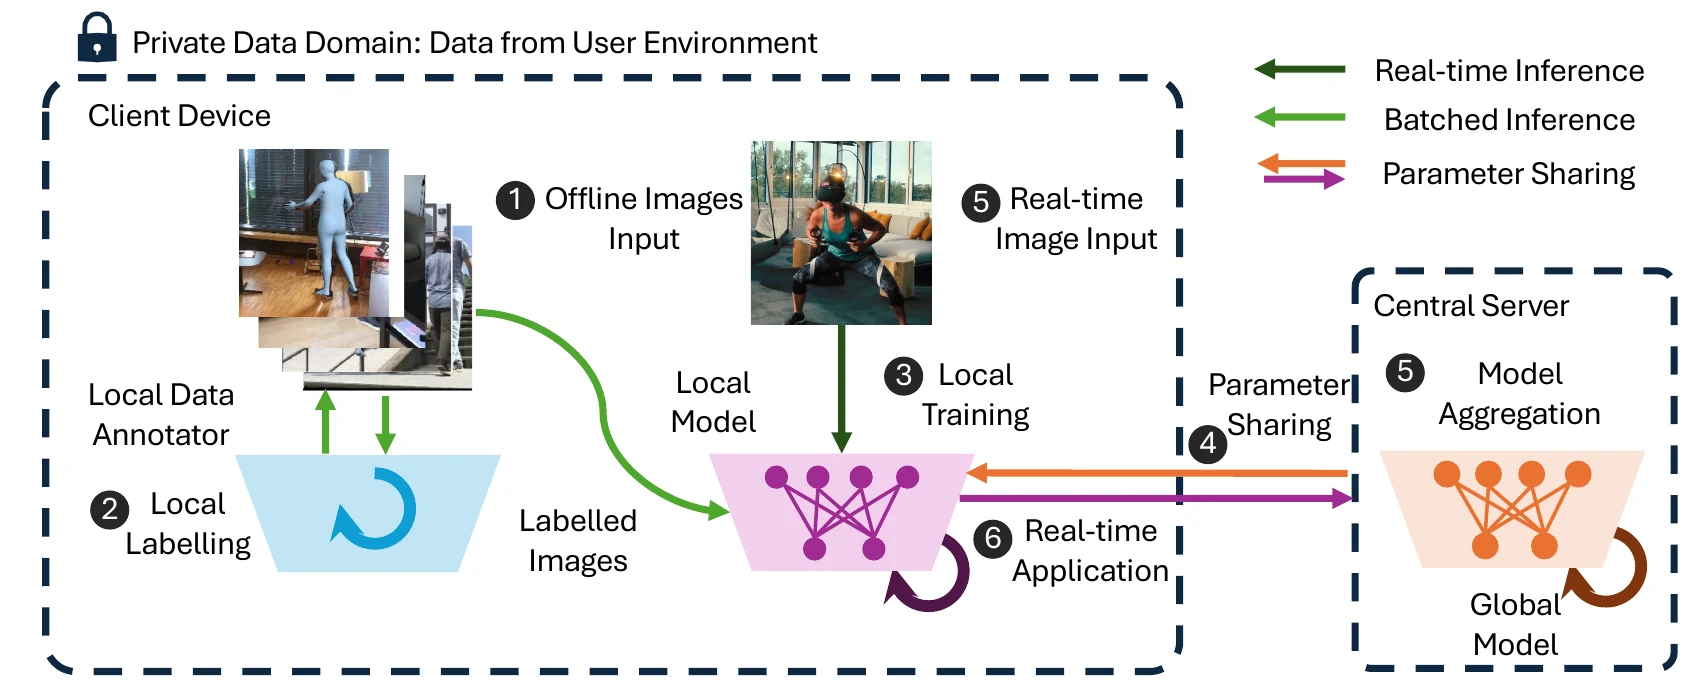
Local annotation, shared training, and local inference.
Training Setup
PCHMR uses Flower to simulate 10, 100, and 1000 clients. Each global round samples 10 clients; all clients participate in the 10-client setting. Each sampled client trains for one local epoch, a single pass over its own data shard, before aggregation. The corresponding IID runs use 200, 2000, and 6000 global rounds. A local epoch, an optimizer step, and a global round describe different amounts of work; the training-budget analysis below makes those differences explicit.
Privacy setting comparison. PCHMR treats centralized HMR as a reference and evaluates federated training, in which raw images remain on each client, plus a secure-aggregation variant.
| Training method | What leaves the client? | Server visibility | Use in PCHMR |
|---|---|---|---|
| Centralized HMR | Raw images and mesh labels | Training data and model | Reference baseline |
| Federated HMR | Model updates | Individual updates and aggregate model | Main benchmark setting |
| Secure aggregation variant | Masked model updates | Aggregated update only | Privacy-strengthened comparison |
Federated training prevents the server from receiving raw images, but the updates and the released model may still reveal information. In the secure-aggregation experiment, the server follows the protocol but may try to inspect the updates; it can see only their aggregate, not each client's update. The study does not claim differential privacy and does not evaluate membership inference, gradient inversion, or model inversion attacks.
Training Budget and Evaluation
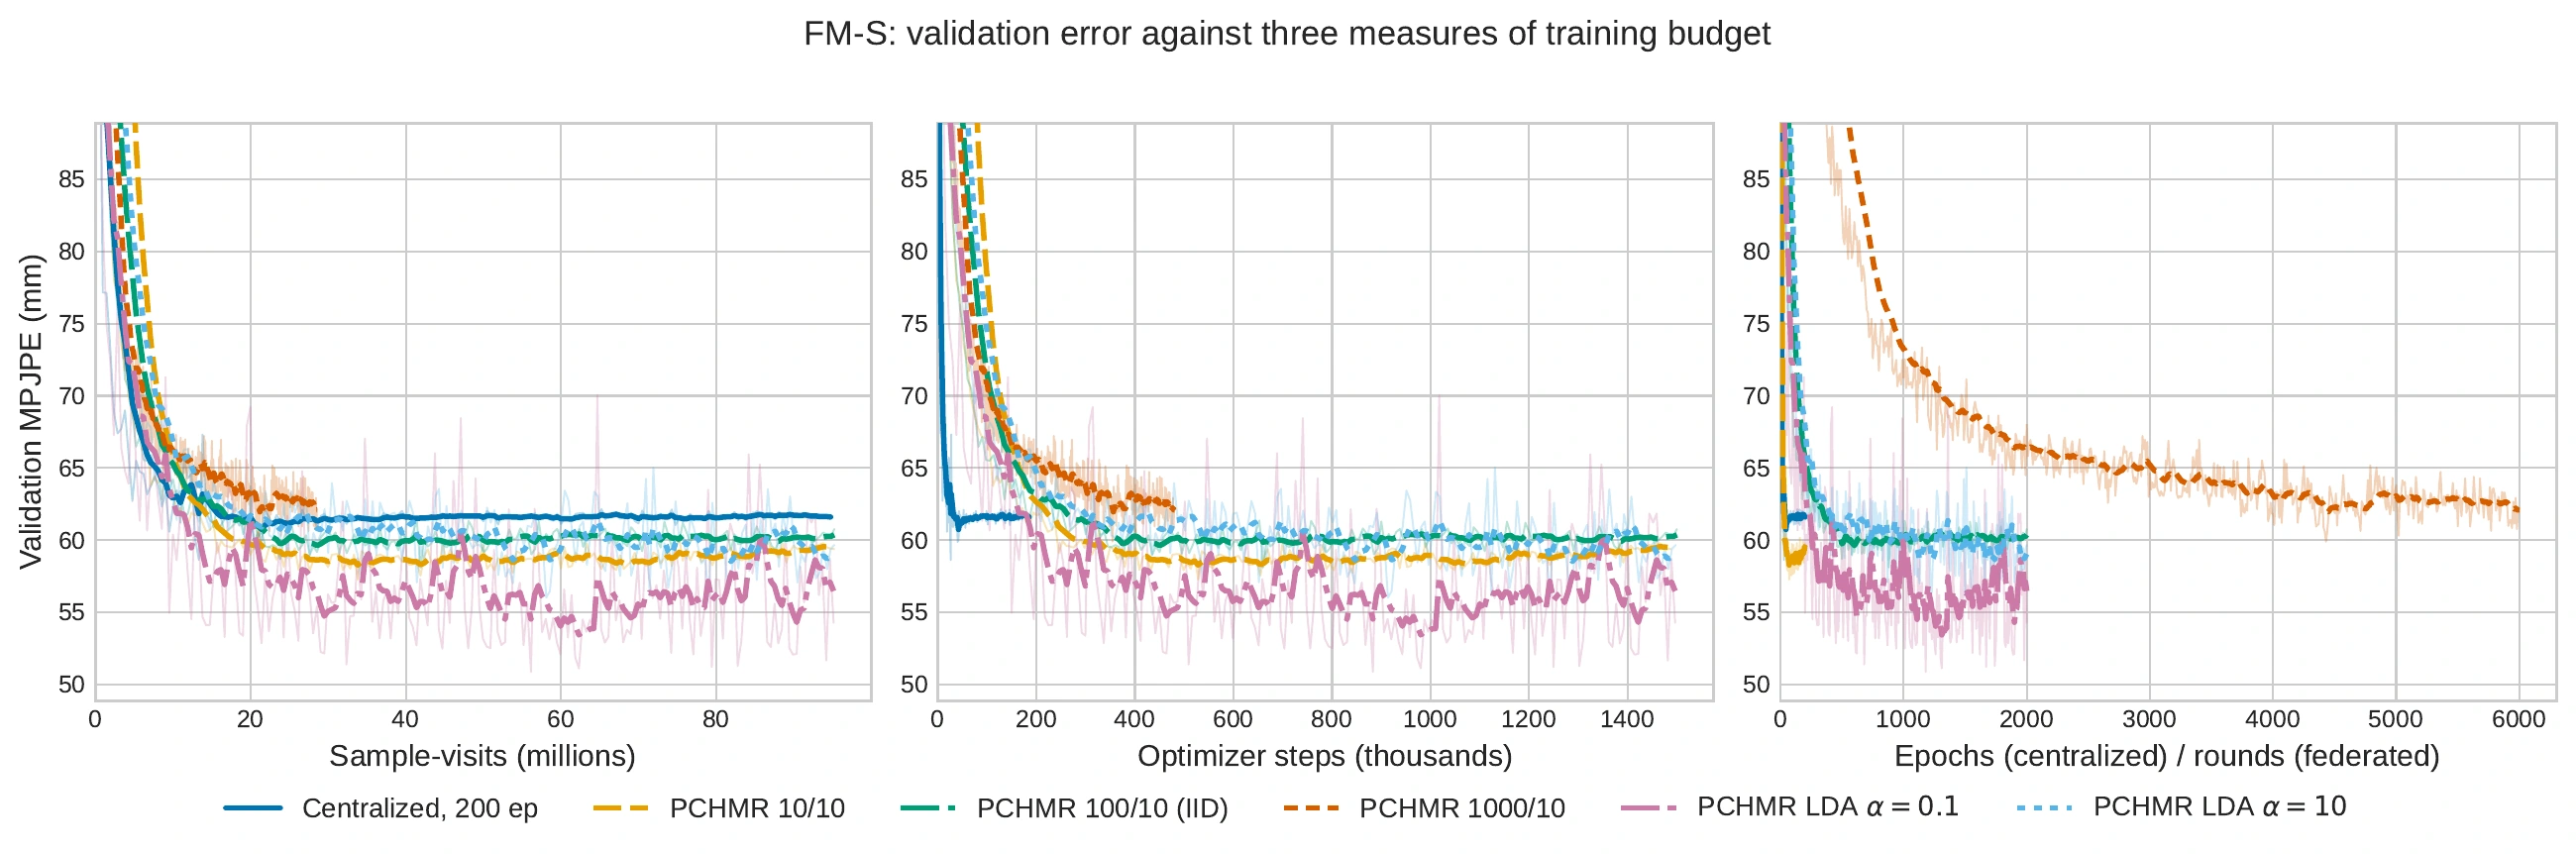
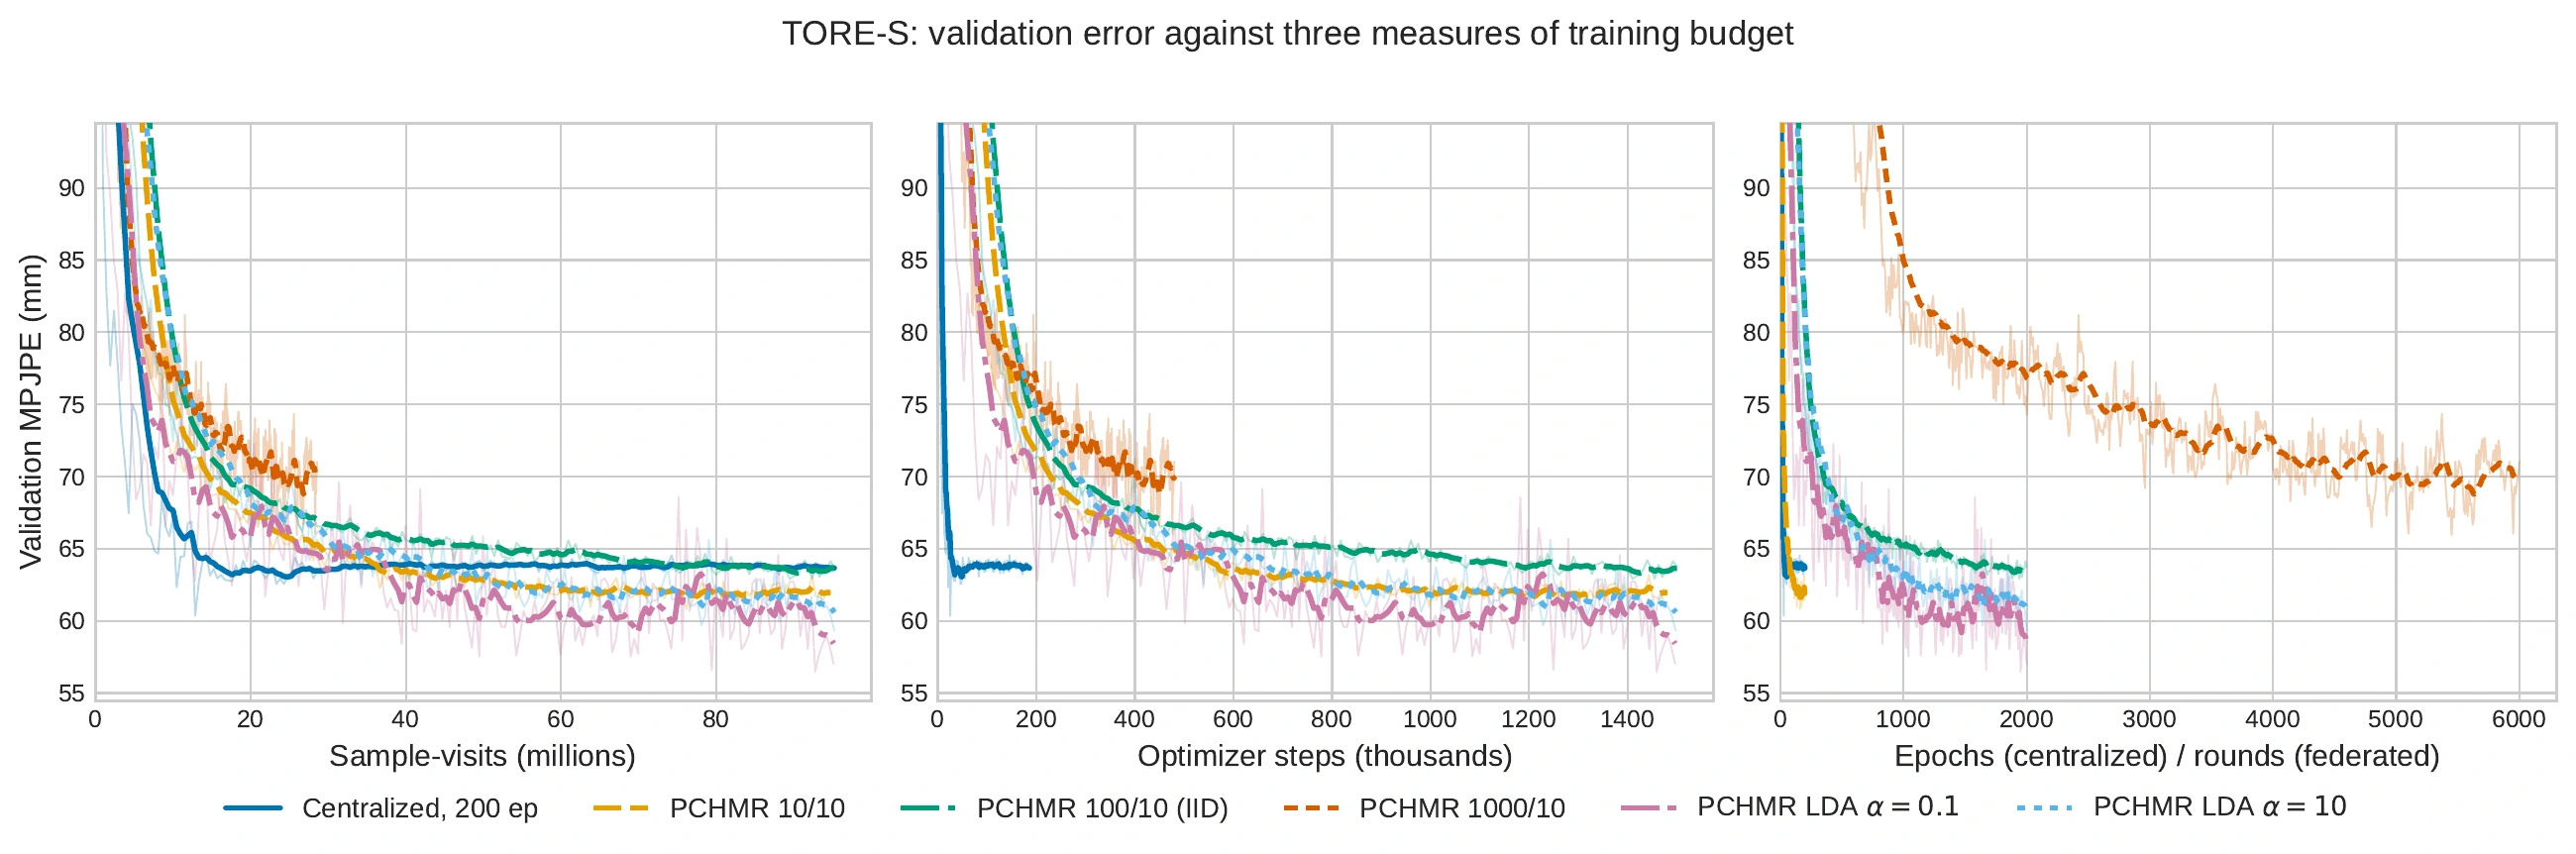
One epoch-equivalent is 476,062 sample-visits, the size of the full training set. The published centralized baselines use 60 epochs; the IID 10/10 and 100/10 runs receive 200 epoch-equivalents, while 1000/10 receives 60. The added 200-epoch centralized run matches sample-visits, but its effective batch of 512 produces far fewer optimizer steps than the federated local batch of 64. Equal data exposure therefore does not imply equal optimization work.
Training budgets and measured simulation cost. Selected settings from the paper's Training Budget appendix. Optimizer steps are summed over clients. The two timing columns refer to different backbones.
| Setting | Budget | Epoch-equivalents | Optimizer steps | FM-S (h) | TORE-S (h) |
|---|---|---|---|---|---|
| Centralized (published) | 60 epochs | 60.0 | 55,800 | 18.9 | 18.7 |
| Centralized (data-pass matched) | 200 epochs | 200.0 | 186,000 | 63.0 | 62.3 |
| PCHMR IID 10 / 10 | 200 rounds | 200.0 | 1,488,000 | 44.3 | 47.1 |
| PCHMR IID 100 / 10 | 2000 rounds | 200.0 | 1,500,203 | 60.5 | 55.9 |
| PCHMR IID 1000 / 10 | 6000 rounds | 60.0 | 480,060 | 56.3 | 60.6 |
| PCHMR LDA α = 0.1 | 2000 rounds | 199.8 | 1,496,597 | 87.4 | 77.7 |
| PCHMR LDA α = 1000 | 2000 rounds | 200.0 | 1,497,387 | 59.2 | 57.4 |
LDA work counts are averaged over partition and client-sampling seeds. Timings are medians over completed runs on a shared cluster with heterogeneous nodes; they describe simulation cost rather than a controlled hardware comparison or real deployment latency. The paper also projects about 500 hours for centralized training at batch 64, but that configuration was not run to completion and is not included among these measurements.
On narrow screens, tap a plot to open it at full size.
The centralized curves reach their best validation error around epochs 26–27, then flatten or worsen. This matters independently of equalizing data passes: extending the centralized schedule does not necessarily improve the reference model. The federated curves also show stronger evaluation-to-evaluation variation, especially with skewed client data.
Both regimes use the same Human3.6M protocol-2 validation split of 27,558 images, evaluated with batch size 256. Reported errors select the best checkpoint on that split; there is no separate held-out test set in this comparison. Centralized runs evaluate each epoch. Federated runs evaluate every round for 10/10 and every ten rounds for 100/10 and 1000/10, giving 200, 200, and 600 validation evaluations respectively.
DePoser Local Annotation
DePoser uses Sapiens 2D keypoints and joint-depth cues to guide SMPLify-X-based body fitting. The paper describes metric-depth alignment with a lightweight linear regressor and a scale-invariant logarithmic (SILog) depth objective. The reported experiment evaluates the combined annotation pipeline rather than isolating the contribution of each component.
LSILog = √[(1/N) Σi di2 − λsi((1/N) Σi di)2], di = log zi − log ẑi.
Here z denotes pseudo-ground-truth joint depth and ẑ predicted joint depth. The paper uses λsi = 0.5; subtracting the squared mean residual reduces the influence of a shared depth-scale difference.
Benchmark Results
Numbers of clients, uneven data partitions, and example reconstructions.
Effect of the Number of Clients
These are the client-scale accuracy results reported in the paper. The 10/10 and 100/10 settings use more sample-visits than the published centralized baselines, while 1000/10 matches their data exposure but performs more optimizer steps. Read the numerical differences together with the budget analysis above; they do not isolate the effect of federated aggregation.
Client-scale evaluation. Human3.6M protocol-2 validation error in millimeters. Lower is better.
| Training setting | Model | Epoch-equivalents | MPJPE | PA-MPJPE | Raw images stay local? |
|---|---|---|---|---|---|
| Centralized (published) | FM-S | 60 | 57.98 | 40.62 | No |
| PCHMR 10 / 10 | FM-S | 200 | 56.85 | 40.52 | Yes |
| PCHMR 100 / 10 | FM-S | 200 | 59.31 | 41.48 | Yes |
| PCHMR 1000 / 10 | FM-S | 60 | 60.82 | 44.53 | Yes |
| Centralized (published) | TORE-S | 60 | 63.88 | 41.99 | No |
| PCHMR 10 / 10 | TORE-S | 200 | 61.27 | 41.60 | Yes |
| PCHMR 100 / 10 | TORE-S | 200 | 62.92 | 43.11 | Yes |
| PCHMR 1000 / 10 | TORE-S | 60 | 66.04 | 44.04 | Yes |
The 1000/10 setting has higher error than the published centralized baseline for both models. The 10/10 setting gives numerically lower errors, but receives 200 epoch-equivalents against the baseline's 60. The paper reports these accuracy values as point estimates; the learning curves and budget analysis provide additional context for their interpretation.
Uneven Client Data
The Dirichlet partitions use source-dataset labels to control how examples are distributed across clients; a smaller α produces stronger skew. Across α = 0.1 to 1000, the runs receive 199.8–200.0 epoch-equivalents and approximately 1.497 million optimizer steps. The low error at α = 0.1 therefore does not come from a larger training budget than the IID 100/10 run. The paper discusses aggregation-induced regularization as a possible explanation, without establishing it as the mechanism.
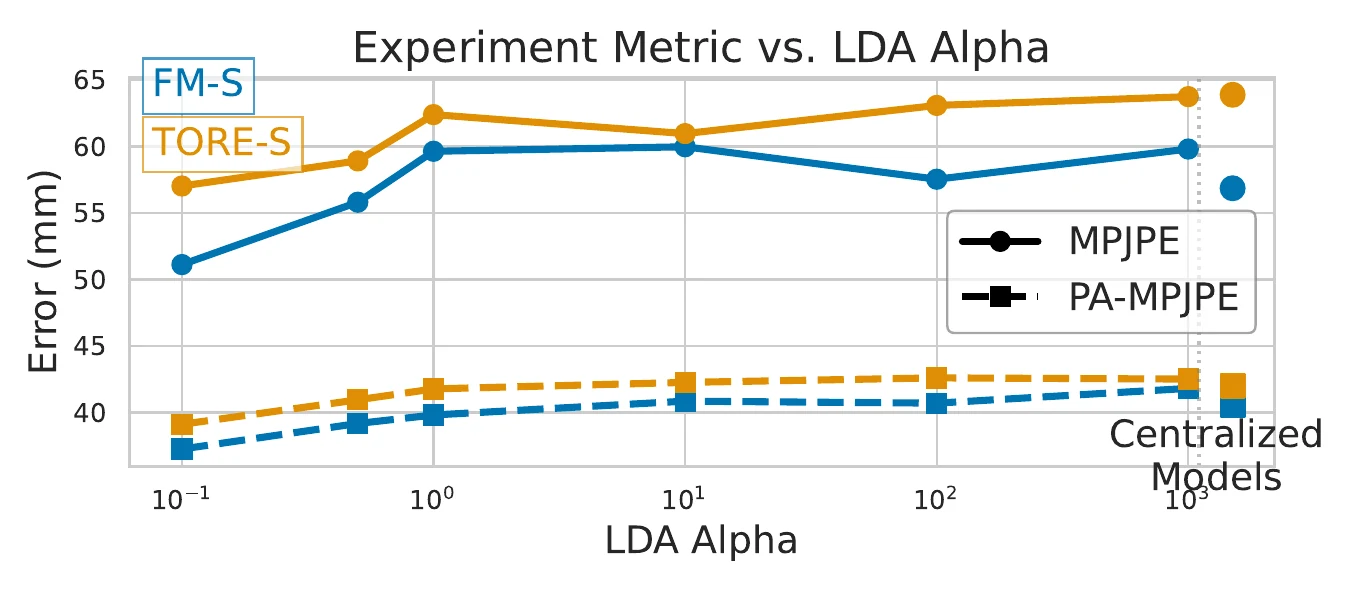
Skew changes who performs the work even when total work stays nearly constant. From α = 1000 to 0.1, the summed per-round workload of the slowest sampled client grows from 154,767 to 707,920 optimizer steps, about 4.6 times. The reported simulation time rises from 59.2 to 87.4 hours for FastMETRO-S and from 57.4 to 77.7 hours for TORE-S. This is the straggler cost of uneven client data.
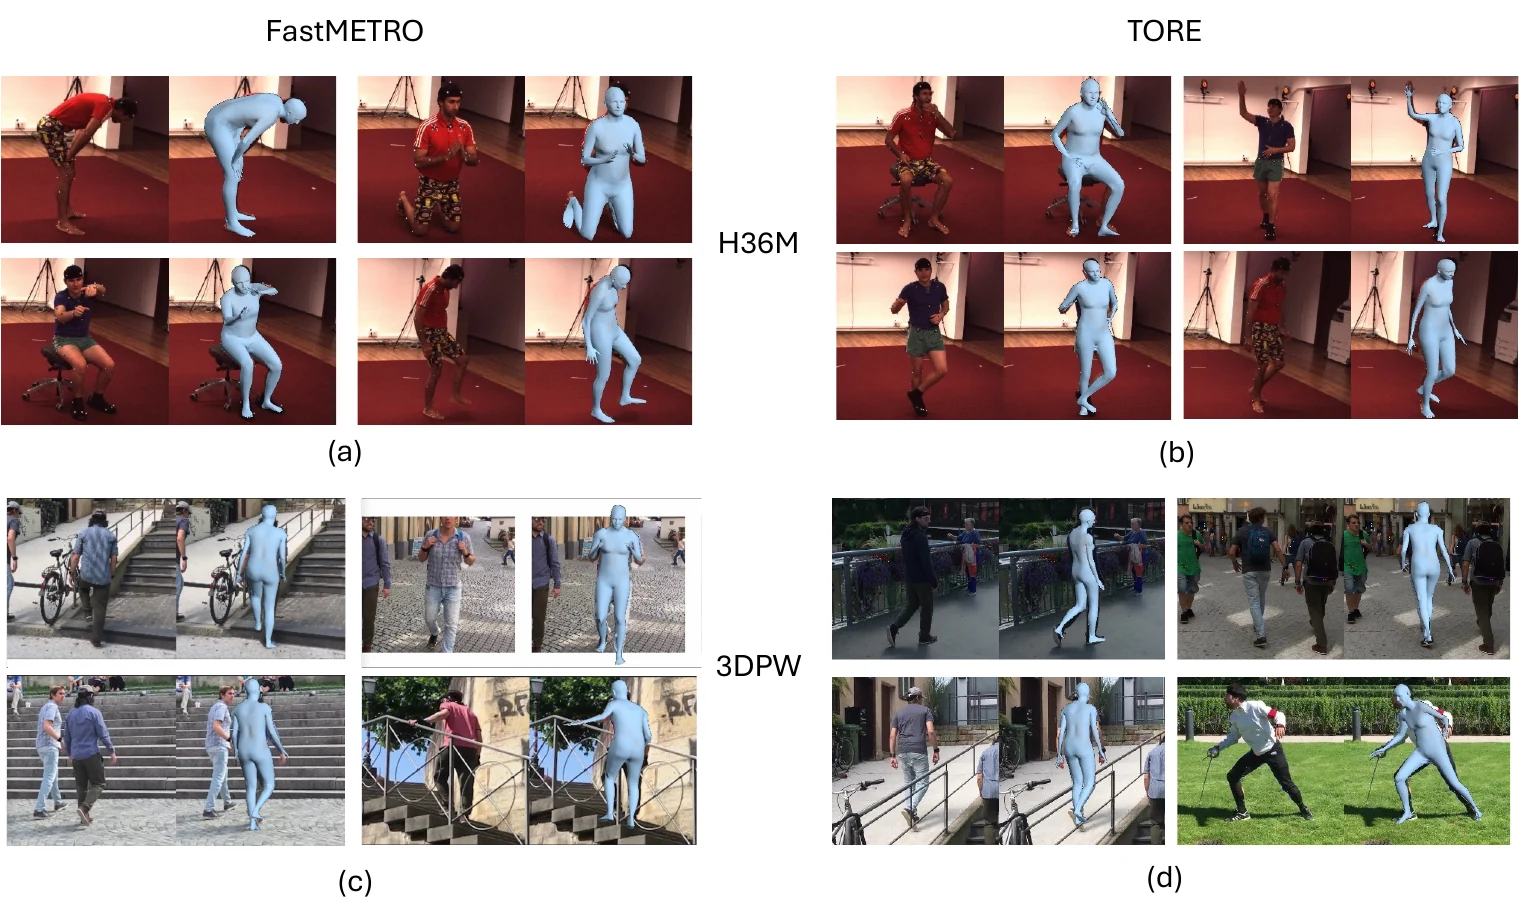
Natural Partition on 3DPW
Natural scene partitions approximate real deployment, where each user's data is shaped by identity, clothing, environment, camera pose, and local data volume.
3DPW fine-tuning. IID fine-tuning uses 100 clients with 10 sampled per round; the natural partition assigns each scene to a client and uses 20 clients with 5 sampled per round. All errors are in millimeters; lower is better.
| Setting | Model | MPJPE | PA-MPJPE | MPVPE | Raw images stay local? |
|---|---|---|---|---|---|
| Centralized | FM-S | 84.92 | 54.69 | 97.60 | No |
| PCHMR | FM-S | 84.66 | 54.78 | 97.42 | Yes |
| PCHMR (Natural Part.) | FM-S | 86.83 | 55.61 | 99.66 | Yes |
| Centralized | TORE-S | 87.97 | 55.35 | 101.88 | No |
| PCHMR | TORE-S | 87.55 | 54.08 | 101.86 | Yes |
| PCHMR (Natural Part.) | TORE-S | 88.00 | 55.07 | 102.50 | Yes |
Local Annotation and Personalization
Locally generated labels and the limits of their evaluation.
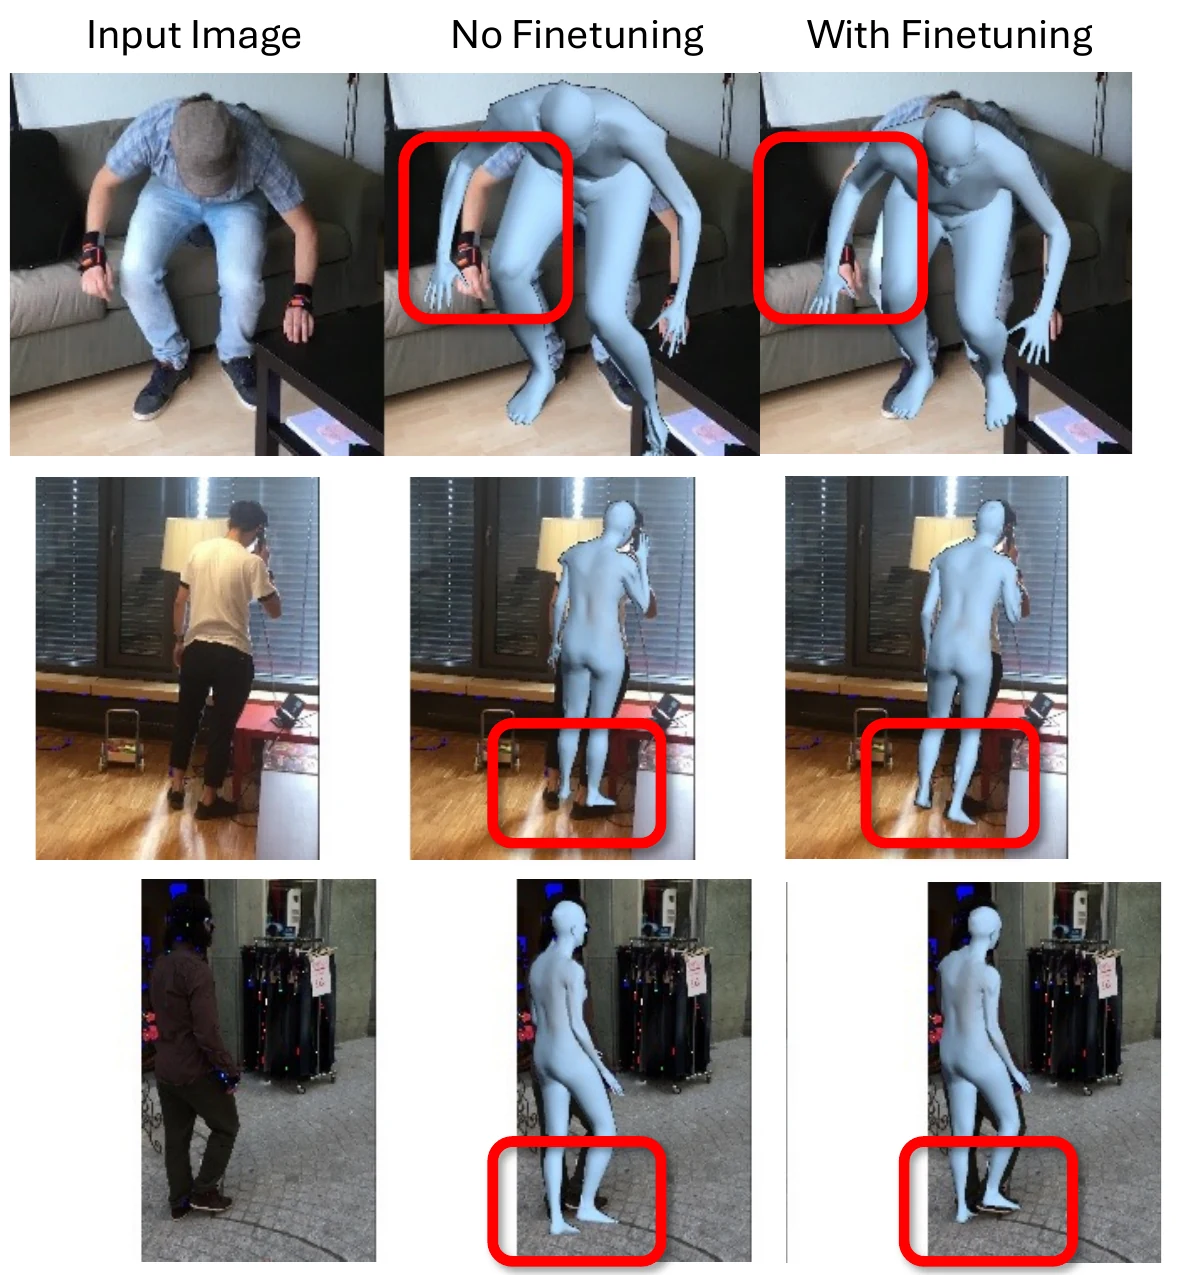
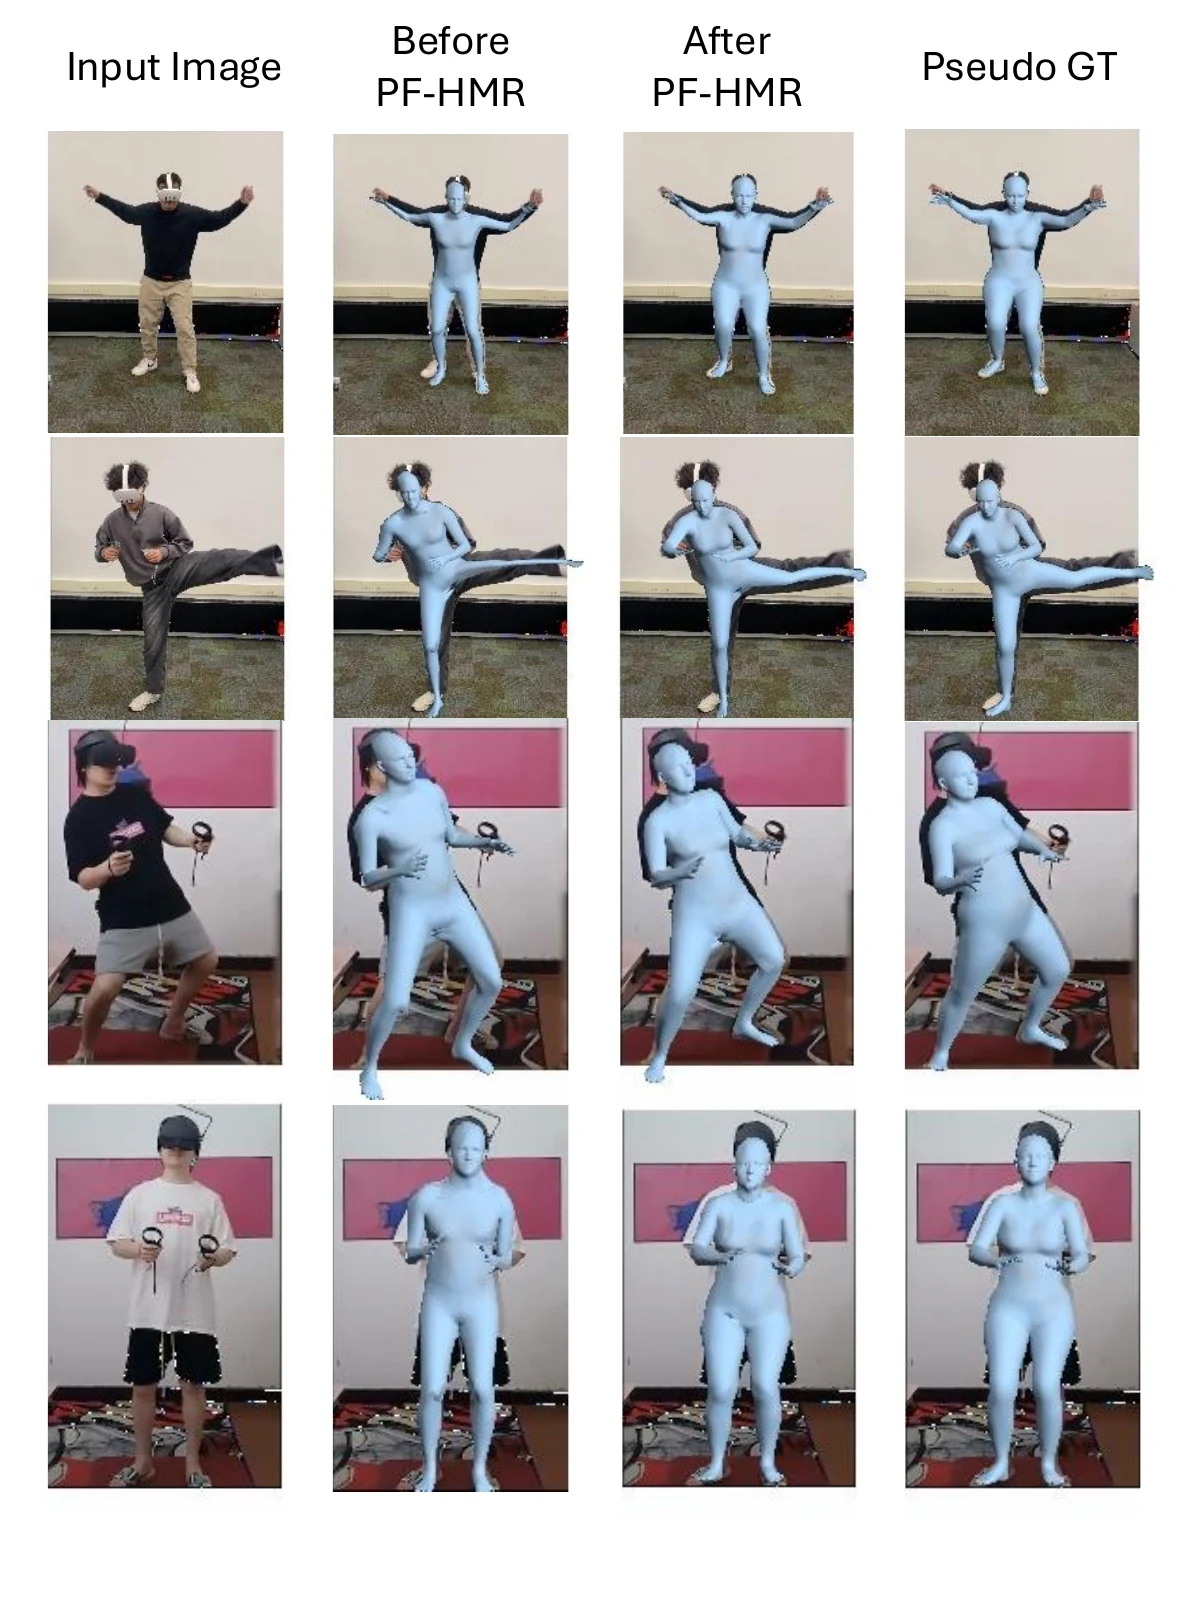
DePoser creates mesh labels from each user's images on that user's device, and those generated labels are used for local fine-tuning. For the in-the-wild examples below, the same labels are also used as the evaluation reference. The reported reductions therefore show that the fine-tuned model agrees more closely with DePoser; they do not establish higher 3D accuracy against independent measurements.
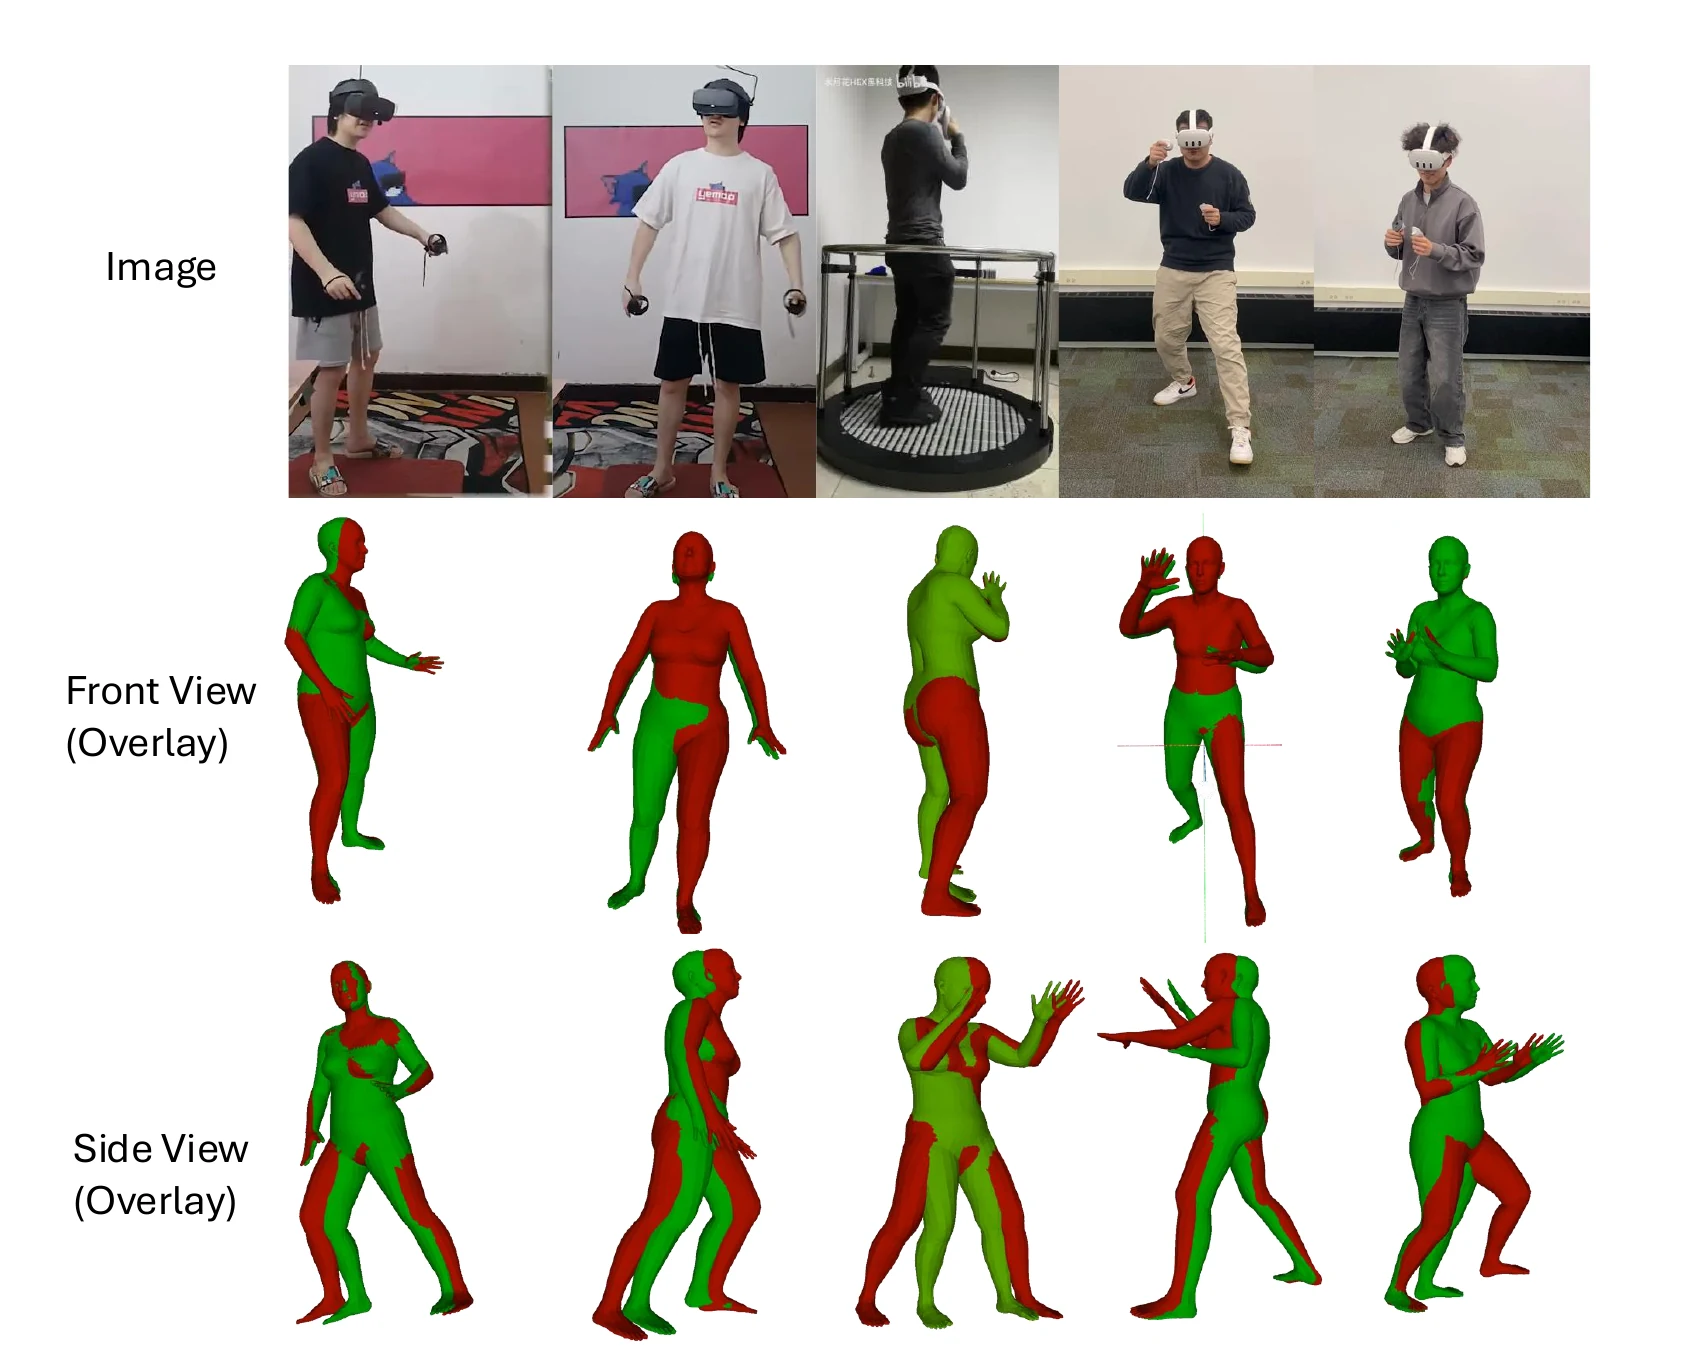
Personalization Results
Agreement with DePoser-generated references. All errors are in millimeters; lower values mean that the fine-tuned model is closer to the labels generated by DePoser. They do not measure accuracy against independent 3D ground truth.
| Dataset | Before / After | Model | MPVPE | MPJPE | PA-MPJPE |
|---|---|---|---|---|---|
| VR-runner | Before PCHMR | FM-S | 109.50 | 114.51 | 60.07 |
| VR-runner | After PCHMR | FM-S | 93.23 | 58.24 | 43.16 |
| VR-game-1 | Before PCHMR | FM-S | 176.24 | 172.57 | 78.21 |
| VR-game-1 | After PCHMR | FM-S | 65.57 | 62.30 | 43.82 |
| VR-game-2 | Before PCHMR | FM-S | 150.64 | 161.82 | 84.36 |
| VR-game-2 | After PCHMR | FM-S | 82.53 | 69.49 | 53.57 |
| Oculus | Before PCHMR | FM-S | 103.92 | 102.22 | 61.62 |
| Oculus | After PCHMR | FM-S | 56.76 | 57.92 | 39.94 |
DePoser and SMPLify-X. Errors in millimeters on a randomly sampled 300-image subset of 3DPW with independent 3D ground truth. This compares complete annotators. Lower is better.
| Method | MPVPE | MPJPE | PA-MPJPE |
|---|---|---|---|
| SMPLify-X | 198.66 | 181.07 | 87.17 |
| DePoser | 162.60 | 151.19 | 71.14 |
The combined DePoser pipeline reduces MPVPE by 36.06 mm, MPJPE by 29.88 mm, and PA-MPJPE by 16.03 mm in this comparison. The experiment does not attribute those improvements separately to the keypoint detector, depth objective, or depth alignment.
Citation
@article{cao2026pchmr,
  title={PCHMR: Empowering and Benchmarking Human Mesh Recovery in Privacy-Constrained Real-World Settings},
  author={Cao, Zeyu and Wu, Qingxuan and Dou, Zhiyang and Xu, Rui and Liu, Yuan and Fernandez-Marques, Javier and Lane, Nicholas D. and Komura, Taku and Wang, Wenping},
  journal={Transactions on Machine Learning Research},
  year={2026}
}